Read 12 in 201
- Chart.js API
- Charts are far better for displaying data visually than tables and have the added benefit that no one is ever going to press-gang them into use as a layout tool.
- t’s a well documented plugin that makes using all kinds of bar charts, line charts, pie charts and more.
- We can actually pass some options to the chart via the Line method.

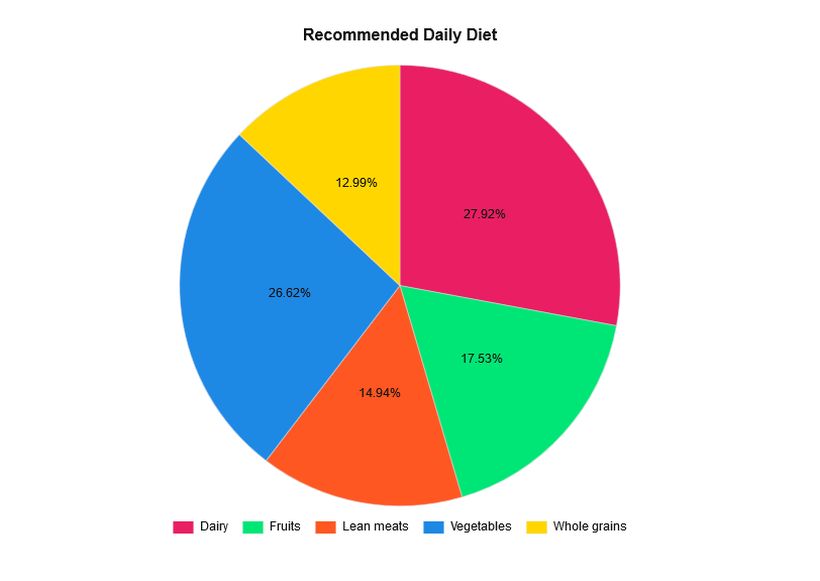
- data for pie chart is a little different to the line chart because the pie chart is simpler, we just need to supply a value and a color for each section.
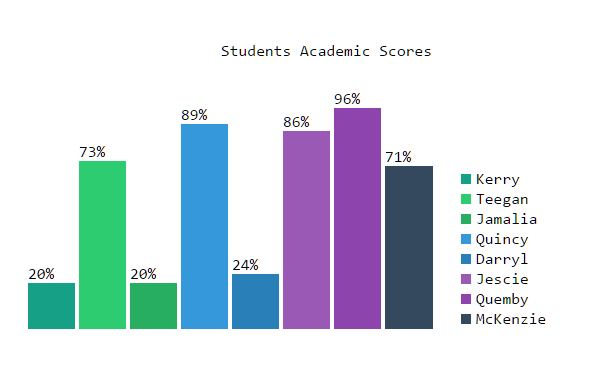
- bar chart is very similar to the line chart
- Basic usage
- the
- The
- Providing fallback content is very straightforward: just insert the alternate content inside the
- The
- Drawing shapes with canvas
- Normally 1 unit in the grid corresponds to 1 pixel on the canvas. The origin of this grid is positioned in the top left corner at coordinate (0,0)
- All elements are placed relative to this origin.
- fillRect(x, y, width, height) :Draws a filled rectangle.
- strokeRect(x, y, width, height):Draws a rectangular outline.
- clearRect(x, y, width, height): Clears the specified rectangular area, making it fully transparent.

- Applying styles and colors
- If we want to apply colors to a shape, there are two important properties we can use: fillStyle and strokeStyle.
- color is a string representing a CSS , a gradient object, or a pattern object. We'll look at gradient and pattern objects later. By default, the stroke and fill color are set to black (CSS color value #000000).
- we can also draw semi-transparent (or translucent) shapes. This is done by either setting the globalAlpha property or by assigning a semi-transparent color to the stroke and/or fill style.
- Drawing text
- fillText(text, x, y [, maxWidth]) :Fills a given text at the given (x,y) position. Optionally with a maximum width to draw.
- strokeText(text, x, y [, maxWidth]) :Strokes a given text at the given (x,y) position. Optionally with a maximum width to draw.